|
iQue Forecyt® Reference Guide (Version 9.0)
|
Overview of the Metrics Screen
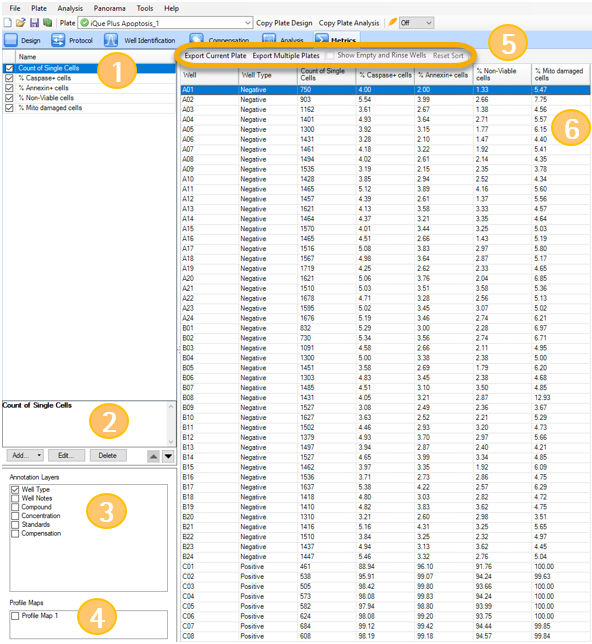
Name (1) lists all the metrics associated with one selected plate of your experiment. Metrics can be selected or de-selected with check boxes. You can Add, Edit or Delete metrics (2) by clicking on them, and use arrows to move a selected metric up or down in the Name list. All Annotation Layers (3) are listed and can be selected or de-selected with check boxes. If there are Profile Maps (4) associated with the plate, they can be selected or de-selected with check boxes. You can Export a plate or plates and Show Empty or Rinse wells if they are associated with the experiment.(5) Metrics are column headings (6) for all data associated with the selected plate. You can click on a column heading to sort that column in ascending order of that column’s values. A second click will sort in descending order. A small arrow will appear in the column title to denote that the column is sorted. An upward arrow denotes ascending order, whereas a downward arrow denotes descending order.
When displaying concentration metrics or derived concentration metrics on the grid, some values may have a red triangle in the top left corner, as shown in the following screenshot. This marks that the values are beyond the linear fit of the curve.
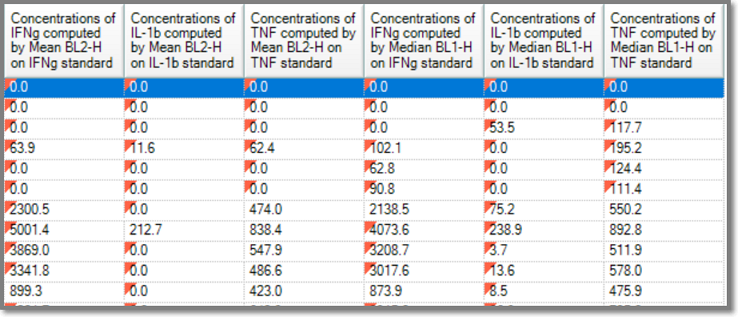
Hovering over the value will provide a tool tip with a message that will provide more information. The messages “Below Linear Range” or “Above Linear Range” signify that the value was outside of the linear range, but still within the concentrations used to calculate the fit.“ The notation <” or “>” followed by a value signify that the calculation was beyond the min and max of the curve fit. The value cannot be calculated and is clamped to the minimum or maximum.
As shown in the following screenshot, some values or columns may have a yellow triangle in the corner. This happens when the system performs a calculation with values at zero. Hovering the tooltip over the value in the grid displays a warning showing the percent of values at zero. Review your gating strategy or switch the parameter from an Area channel to a Height channel to provide more accurate results.

If a calculated metric returns an non-numerical result (such as dividing by zero) the displayed metric will be NaN (Not a Number).